Informes en PDF
Studio le permite editar informes en PDF existentes (como facturas, cotizaciones, etc.) y crear nuevos.
Diseño predeterminado
The default layout of reports is managed outside Studio. Go to , then, in the Companies section of the main page, click Configure Document Layout. Layout settings are company-specific but apply to all reports.
Truco
You can see how the different settings affect the report layout in the report preview on the right side of the Configure your document layout window. When creating or editing a report, you can see a preview of the report by clicking Print preview on the left side of the screen.
Use los siguientes ajustes:
Layout: Seven layouts are available:


Background: The following backgrounds are available:
Blank: Nothing is displayed.
Demo logo: A demo logo is displayed in the background.
Custom: Upload a custom background image.
Text: Eight fonts are available: Lato, Roboto, Open Sans, Montserrat, Oswald, Raleway, Tajawal (which supports Arabic and Latin scripts), and Fira Mono. Go to the Google Fonts website to preview them.
Logotipo de la empresa: haga clic en el botón Editar para subir o modificar el logo. Esta acción agrega el logotipo al registro de la empresa en el modelo de la empresa. Puede acceder si va a , se dirige a la sección Empresas y luego hace clic en Actualizar información.
Colores: cambie los colores primarios y secundarios que se utilizan para estructurar los informes. Los colores predeterminados se generan de forma automática con los colores del logotipo.
Address: The company name and address are displayed in the header of external reports. You can add multiple lines of text.
Tagline: This is displayed in the header of external reports using the Light, Striped, Bubble, Wave and Folder layouts and in the footer of external reports using the Boxed and Bold layouts. You can add multiple lines of text.
Paper format: This defines the default paper size of reports. You can select A4 (21 cm x 29.7 cm) and US Letter (21.59 cm x 27.54 cm). This can also be defined for individual reports in the Paper format field in Studio.
Nota
Other paper formats may be available depending on which apps or modules you have installed, for example, label sheets for the Inventory app or event badges for the Events app.
Crear nuevos informes PDF
To create a new report for a model, (e.g., sales orders) access the model, click the (Toggle Studio) button, then click Reports. Click New and, in the popup window that opens, select the type of report. This is solely used to determine what is displayed in the header and footer:
Después de que creó el informe podrá comenzar a editarlo.
Editar informes PDF
To access the reports available for a model, access the model, click the (Toggle Studio) button, then click Reports. Select an existing report to open it.
También puede abrir Studio, hacer clic en Informes y buscar un informe o modelo en particular.
Importante
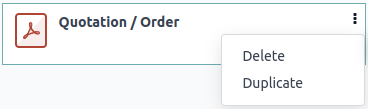
It is strongly recommended to duplicate the standard report and make changes in the duplicated version. To duplicate a report, hover the mouse pointer on the top right corner of the report, click the (vertical ellipsis) icon, and then select Duplicate.
Opciones
Once you have selected or created a report, you can use the options in the left part of the screen to:
Change the Report name: The new name is applied everywhere (in Studio, in the Print menu under the (gear) icon in the form view, and in the PDF file name).
Modify the Paper format: If no value is selected, the format defined in the default layout is used.
Show in print menu: to add the report to the Print menu in the form view.
Volver a cargar desde archivo adjunto: para guardar el informe como un archivo adjunto en el registro la primera vez que se genera y volver a cargar la versión original del informe después. Esto es necesario de forma legal para las facturas y por lo general se utiliza en este caso.
Limitar visibilidad a grupos: para limitar la disponibilidad del informe en PDF a grupos de usuarios específicos.
Editar fuentes: para modificar el informe directo desde el archivo XML.
Restablecer informe: para descartar todos los cambios realizados en el informe y restablecerlo a su versión estándar.
Vista previa de impresión: para generar y descargar una vista previa del informe.
Editor de informes
The report editor allows you to modify the content and formatting of the report.
Truco
You can Undo or Redo changes using the related buttons or the shortcuts
CTRL+ZandCTRL+Y.Los cambios se guardan en automático cuando sale del informe, también puede guardarlos de forma manual con el botón Guardar.
Puede restablecer el informe a su versión estándar si hace clic en el botón Restablecer informe que está ubicado en la parte izquierda de la pantalla.
Importante
Editar el encabezado y el pie de página de un informe afectara a los informes estándar y a los personalizados.
Bloques condicionales
Los rectángulos punteados representan bloques condicionales (sentencias if-else). Estos se utilizan para mostrar u ocultar contenido según condiciones específicas. Haga clic en el bloque para ver las condiciones.
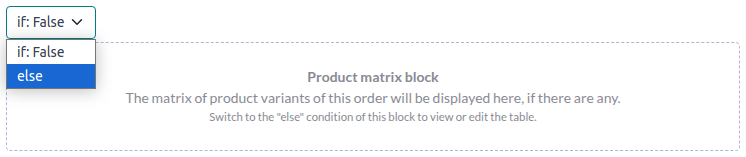
Seleccione un valor para previsualizar el resultado correspondiente y edítelo si es necesario.
Nota
Conditions can only be edited in the XML.
Otro contenido
Hay dos tipos de contenido de texto en los informes:
Static text, i.e., the text that is not highlighted in blue, which can be modified directly in the editor.
Dynamic text, i.e., the text that is highlighted in blue, which is replaced by field values when the report is generated, e.g., the sales order number or the quotation date.
You can add content (e.g., fields, lists, tables, images, banners, etc.) to the report using
commands. Type / to open the powerbox, then type the
command’s name or select it from the list.
Para agregar texto estático solo deberá escribirlo en donde sea necesario.
En caso de que necesite realizar cambios más avanzados, puede editar el informe directo en el XML.
Agregar un campo
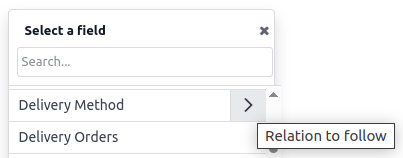
To add a field, type / and select the Field command. In the list that opens, select
or search for the field; click the right arrow next to the field name to access the list of related
fields if needed. Then, specify the default value that will be shown if the field is not completed
in the record and press Enter.
Add or edit a table
There are two types of tables in reports:
Static tables, which are used to display static text or fields. For this type of table, you define the number of columns and rows when adding the table.
Dynamic tables, which are used to display data from relational fields. For this type of table, you only define the number of columns when adding the table. The number of rows in the generated report will be determined by the number of records in the related model that are linked with the current model.
Example
In a sales order report, a dynamic table is used to show the order lines related to the sales order. If the sales order contains 10 order lines, the table in the generated report has 10 rows; if it contains two order lines, the table has two rows.
Add or edit a static table
To add a static table, type / and select the Table command. Determine the number of
columns and rows for the table. Once the table has been added, you can start editing it.
You can insert, move and delete columns and rows using the table tools. Position the cursor on top of the column or to the left of the row then click the purple rectangle and select an option.
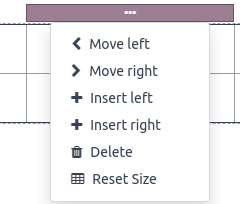
To resize a column, drag the column border to the desired position; reset all columns to their standard size by selecting Reset Size from the table tools.
Add the field of your choice in a cell or add static text by typing.
Truco
To add text in a structured way without using a table, you can use columns. Add columns by
typing / and selecting the appropriate command: 2 columns, 3 columns or
4 columns.
Add or edit a dynamic table
Nota
Only relations of type
one2manyormany2manycan be displayed as dynamic tables.An existing dynamic table in a standard report has a more complex structure than a dynamic table you add yourself. For such tables, it is possible to insert or delete columns; it is not possible to move columns or to insert, move or delete rows.
To add a dynamic table, type / and select the Dynamic Table command. In the list that
opens, select or search for the relation the table will be based on and press Enter. Once the
table has been added, you can start editing it.
You can insert, move and delete columns using the table tools, as for a static table. It is also possible to insert static rows that will appear above or below the generated rows.
To add a field to a cell, delete any placeholder text then add the field of your choice. The dialog box that opens shows the source object for the field (e.g., the Order Lines model) and the list of available fields.
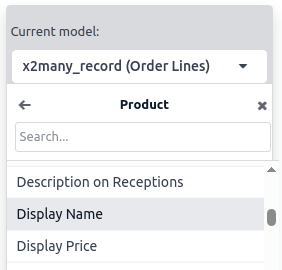
Replace the Column name label by the label of your choice.
Nota
The default row automatically iterates over the field’s content, generating a row on the report for each field value (e.g., one row per order line).
Formato
To format text in the report, select it, then format it using the options in the text editor.

Editar el XML de un informe
Advertencia
Modificar el XML podría ocasionar errores en los informes durante la actualización. Si esto ocurre, solo copie los cambios de la base de datos anterior en su base de datos actualizada.
Haga clic en Editar fuentes en el panel izquierdo para editar el XML del informe.
Ejemplos
To change how data is presented in your report, you can modify a field’s default widget manually. In the example below, the order date shows the date and time by default, while the unit price defaults to a precision of two decimal places.
<div class="oe_structure">
 <span t-field="doc.date_order"/>
 <span t-field="doc.price_unit"/>
</div>
By using t-options, in this case the widget option, these fields can be modified to show
only the date and a precision of four decimal places, respectively:
<div class="oe_structure">
 <span t-field="doc.date_order" t-options="{'widget': 'date'}"/>
 <span t-field="doc.price_unit" t-options="{'widget': 'float', 'precision': 4}"/>
</div>
Si desea mostrar u ocultar contenido según condiciones específicas puede agregar declaraciones de control if/else de forma manual al XML del informe.
Por ejemplo, si desea ocultar una tabla de datos personalizada en caso de que no haya etiquetas, puede utilizar el atributo t-if para definir la condición. Esta se evaluará como True o False y la tabla no aparecerá si no hay etiquetas en la cotización.
<!-- table root element -->
<table class="table" t-if="len(doc.tag_ids) > 0">
    <!-- thead = table header, the row with column titles -->
    <thead>
        <!-- table row element -->
        <tr>
            <!-- table header element -->
            <th>ID</th>
            <th>Name</th>
        </tr>
    </thead>
    <!-- table body, the main content -->
    <tbody>
        <!-- we create a row for each subrecord with t-foreach -->
        <tr t-foreach="doc.tag_ids" t-as="tag">
            <!-- for each line, we output the name and price as table cells -->
            <td t-out="tag.id"/>
            <td t-out="tag.name"/>
        </tr>
    </tbody>
</table>
Si desea mostrar otro bloque en caso de que la declaración t-if se evalúe como False, puede especificarlo con la declaración t-else. El bloque t-else debe estar inmediatamente después del bloque t-if en la estructura del documento. No es necesario que especifique alguna condición en el atributo t-else. Como ejemplo, veamos cómo mostrar un mensaje rápido que explique que la cotización no tiene etiquetas:
<!-- table root element -->
<table class="table" t-if="len(doc.tag_ids) > 0">
    <!-- thead = table header, the row with column titles -->
    <thead>
        <!-- table row element -->
        <tr>
            <!-- table header element -->
            <th>ID</th>
            <th>Name</th>
        </tr>
    </thead>
    <!-- table body, the main content -->
    <tbody>
        <!-- we create a row for each subrecord with t-foreach -->
        <tr t-foreach="doc.tag_ids" t-as="tag">
            <!-- for each line, we output the name and price as table cells -->
            <td t-out="tag.id"/>
            <td t-out="tag.name"/>
        </tr>
    </tbody>
</table>
<div class="text-muted" t-else="">No tag present on this document.</div>
Al utilizar la notación t-if/t-else, el editor de informes reconoce que estas secciones se excluyen entre sí y deben aparecer como bloques condicionales:
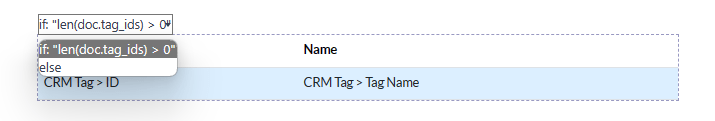
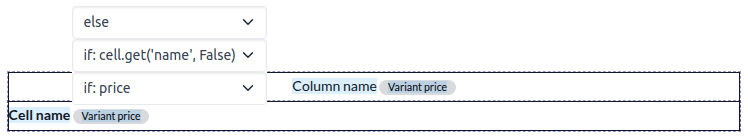
Puede alternar entre condiciones con el editor para previsualizar los resultados:

En caso de que desee tener varias opciones también puede utilizar las directivas t-elif para agregar condiciones intermedias. Por ejemplo, aquí el título de los informes de las órdenes de venta cambia según la condición del documento correspondiente.
<h2 class="mt-4">
    <span t-if="env.context.get('proforma', False) or is_pro_forma">Pro-Forma Invoice # </span>
    <span t-elif="doc.state in ['draft','sent']">Quotation # </span>
    <span t-else="">Order # </span>
    <span t-field="doc.name">SO0000</span>
</h2>
El título Factura proforma se utiliza en función de algunas condiciones contextuales. Si estas condiciones no se cumplen y el estado del documento es draft o sent, entonces se utiliza Cotización. Si ninguna de esas condiciones se cumple, el título del informe es Orden.
Working with images in a report can be challenging, as precise control over image size and
behavior is not always obvious. You can insert image fields using the report editor
(by using the Field command), but inserting them in XML
using the t-field directive and accompanying t-options attributes provides better sizing and
positioning control.
Por ejemplo, el siguiente código muestra el campo image_128 del producto de la línea como una imagen de 64 píxeles de ancho (con una altura automática según la relación de aspecto de la imagen).
<span t-field="line.product_id.image_128" t-options-widget="image" t-options-width="64px"/>
Las siguientes opciones están disponibles para los widgets de imagen:
width: ancho de la imagen. Por lo general se usan píxeles o unidades de longitud CSS (por ejemplo,rem) (no lo use si desea que el ancho se establezca de forma automática).height: altura de la imagen. Por lo general se usan píxeles o unidades de longitud CSS (por ejemplo,rem) (no lo use si desea que la altura se establezca de forma automática).class: las clases CSS aplicadas en la etiquetaimg. También están disponibles las clases de Bootstrap.alt: texto alternativo de la imagen.style: atributo de estilo. Le permite anular estilos con mayor libertad que con las clases de Bootstrap.
Estos atributos deben contener cadenas, es decir, texto entrecomillado dentro de otras comillas, por ejemplo, t-options-width="'64px'" (o una expresión Python válida como alternativa).
Nota
No puede utilizar el widget de imagen en una etiqueta img. Use t-field en un nodo span (para contenido en línea) o div (para contenido en bloque).
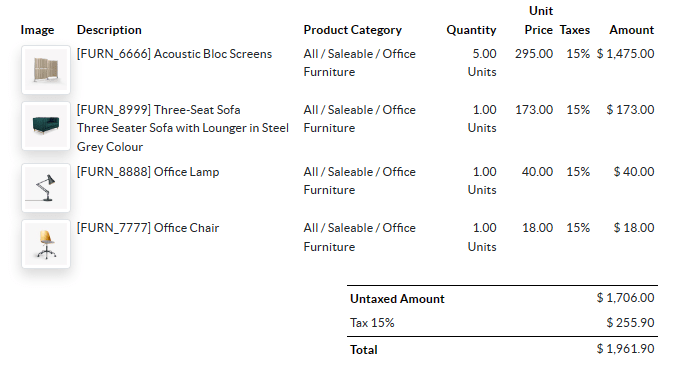
Por ejemplo, es necesario agregar una columna con la imagen del producto a la tabla de la cotización:
<table class="table table-sm o_main_table table-borderless mt-4">
    <thead style="display: table-row-group">
        <tr>
            <th>Image</th>
            <th name="th_description" class="text-start">Description</th>
            <th>Product Category</th>
            <th name="th_quantity" class="text-end">Quantity</th>
            <th name="th_priceunit" class="text-end">Unit Price</th>
[...]
        <t t-foreach="lines_to_report" t-as="line">
            <t t-set="current_subtotal" t-value="current_subtotal + line.price_subtotal"/>
            <tr t-att-class="'bg-200 fw-bold o_line_section' if line.display_type == 'line_section' else 'fst-italic o_line_note' if line.display_type == 'line_note' else ''">
                <t t-if="not line.display_type">
                   <td>
                       <span t-field="line.product_template_id.image_128"
                             t-options-widget="'image'"
                             t-options-width="'64px'"
                             t-options-class="'rounded-3 shadow img-thumbnail'"
                           />
                   </td>
                    <td name="td_name"><span t-field="line.name">Bacon Burger</span></td>
                    <td t-out="line.product_id.categ_id.display_name"/>
El atributo t-options-width restringe el ancho de la imagen a 64 píxeles y las clases de Bootstrap que se utilizan en t-options-class crean un borde similar a una miniatura con las esquinas redondeadas y una sombra.