Skip to Content
Menu
This question has been flagged
2 Replies
1351 Views

I am trying to calculate burdened (wrap) rates for a company.  To do this I need to be able to analyze my expenses.  More specifically:

1.  Distinguish between direct and indirect expenses (direct expenses are for a specific job or cost objective and indirect expenses are for more than one job or cost objective).  I am currently doing this by assigning an analytical tag to all direct expenses.

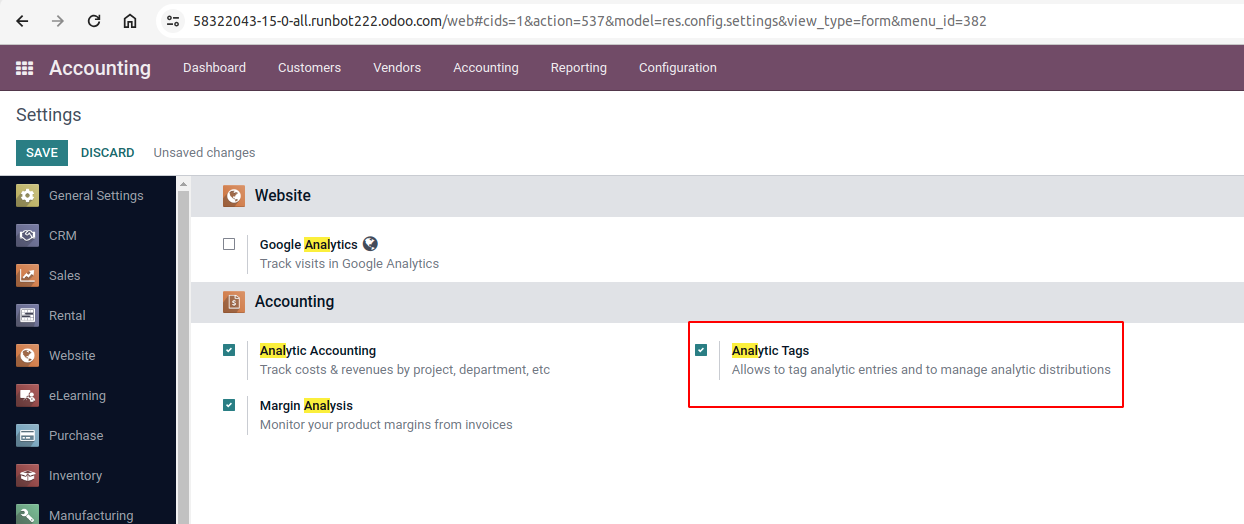
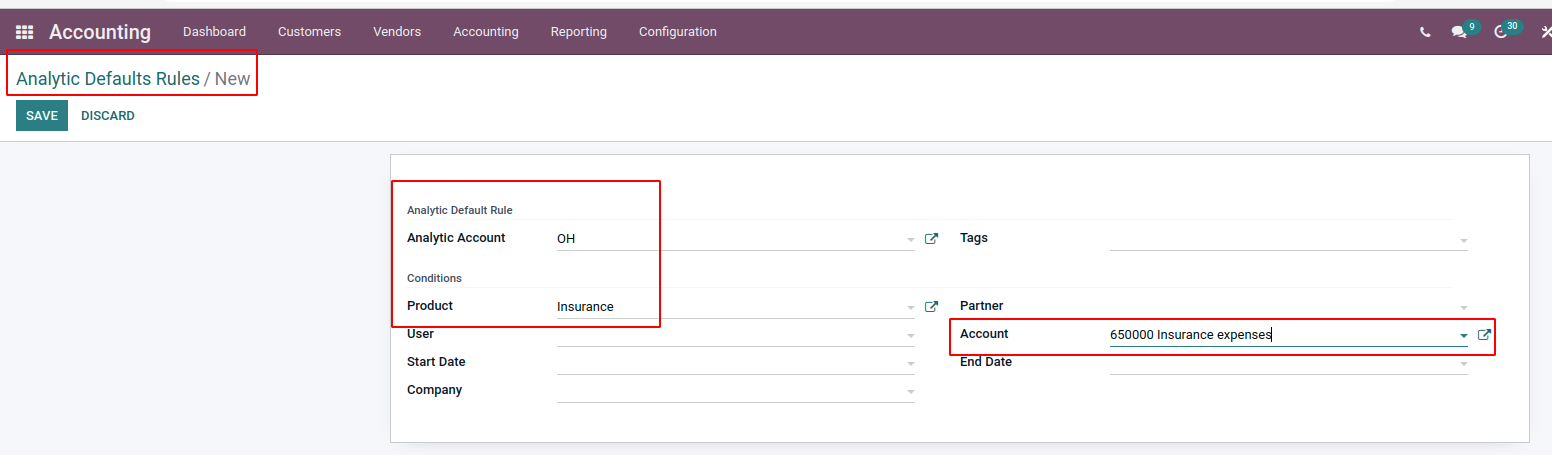
2.  Part of this process is to 'pool' various indirect expenses.  By this, I mean categorizing indirect expenses by Overhead, Fringe Benefits and General and Administrative expenses.  I have tried to do this by going into the Chart of Accounts and assigning 'Tags' to each expense item (OH, FB, GA).  So far, so good.

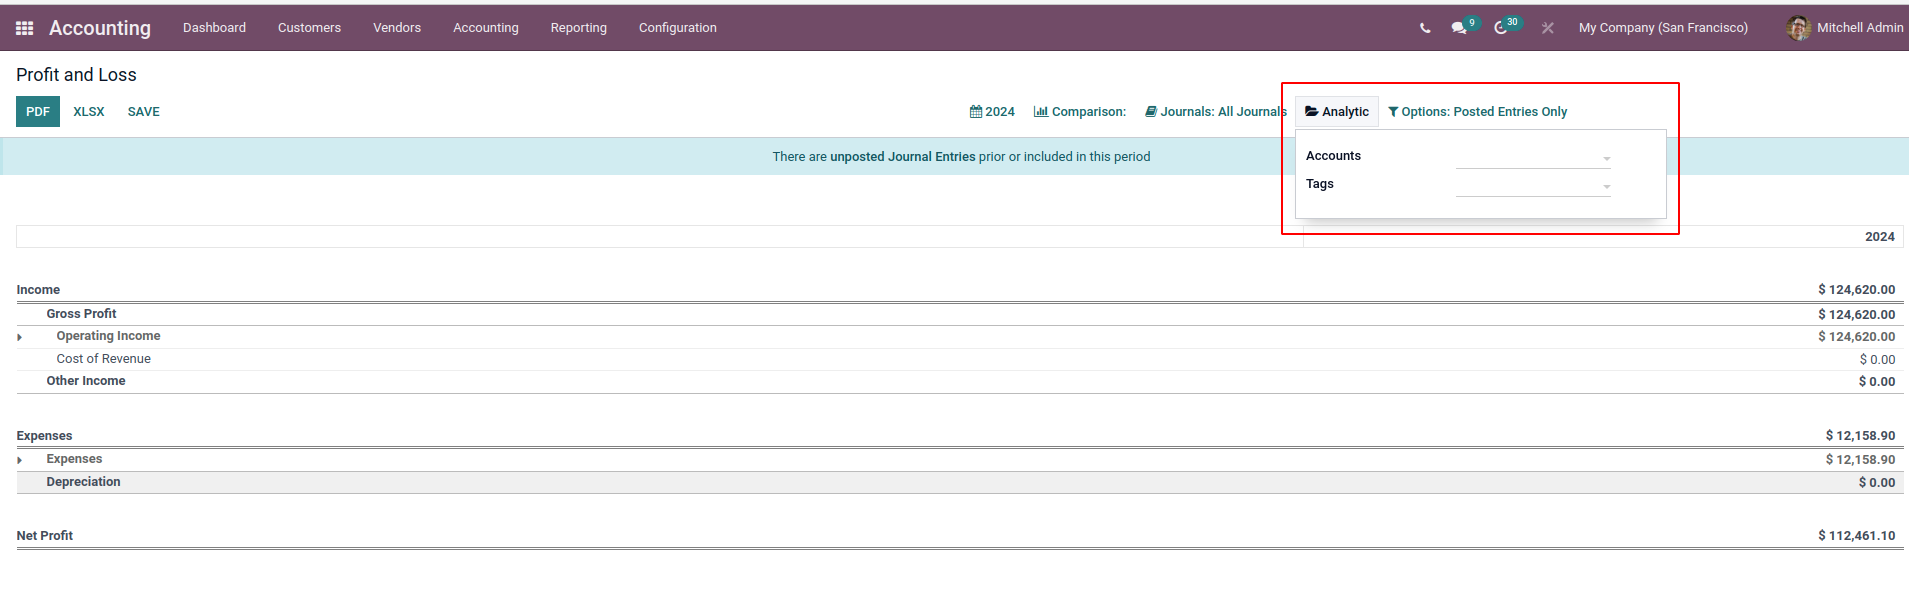
Now, I want to be able to generate a report, for example, that shows me all the indirect overhead expenses for, say, 2023 by chart of accounts line item (e.g., depreciation).   I have found a way to do this by going into the Chart of Accounts|Setup and then filtering until I get what I want...but it is sooooo slow and tedious.  Does anyone know of a better approach?

Avatar
Discard
Best Answer

You could ease encoding and reporting processes as follows:

- Create an analytic account for every indirect cost. Note: in case an expense could be categorized to more than one analytic account, you can make use of analytic tags (otherwise called analytic distributions):

- Every time you have an indirect cost, make sure you tag it against the appropriate analytic account or analytic tag. You can automate this by setting up "Analytic Default rules" so that you don't have to manually enter analytic accounts everytime you select a product or epxense on a vendor bill:


From there, you will simply need to go to your Accounting > "Analytic reports" or again to your P&L report and filter using analytic accounts as per following:


Hope this helps.

Avatar
Discard
Author Best Answer

For what it's worth and to readers that may be looking for an answer to the question that I posted.  I spent today trying to find a better alternative and, short of custom programming, don't believe that there's a better approach than the one we are now using.  To summarize (Odoo 15 Ent.):

1. For each expense in the Chart of Accounts (CoA), we created a tag to identify it as either overhead, fringe benefits or general and administrative (OH, FB, GA).  Many companies may choose to simply call all three of these OH or they may choose to add other 'pools.'

2. To identify totals for each CoA line item, go to Reporting|Profit and Loss and then begin by expanding the Expenses section and export it into an Excel file.

3.  Then, in the same Expenses section, open up each CoA expense item.  We have been using Analytical Tags to identify specific construction jobs and are assuming that any expense with an Analytical Tag is a direct expense.  We use the filter to exclude direct expenses (Analytical Tag - Not Set), leaving us with the indirect expenses.  We then take that total and record it in the corresponding line item in the Excel file.

This is a more tedious approach than I would have liked but...we'll only do it once or twice a year so, I can live with that.

We made so many mistakes when we first started using the accounting module that we're going to create a new database and start fresh in 2024.  I may well simply categorize the CoA in a way that recognizes the various pools directly in the CoA.  This would also include separating out direct and indirect expenses (the way we're doing it now, our Cost of Revenue line items ends up being zero dollars, even though we can filter on specific analytical accounts and adjust accordingly.

I hope all this will help in some small way.  If anyone knows how to approach it better...feel free to contribute.


ADDENDUM: Patrick, thank you for your response.  I'll need to digest what you've written (which would seem to have a great deal of merit).  Thank you for taking the time to respond.  I, no doubt, will be the better for it. 

Avatar
Discard
Related Posts Replies Views Activity
1
Apr 25
96
0
Apr 25
88
0
Apr 25
2
0
Apr 25
121
0
Apr 25
98